
| Takeaway | Detail |
|---|---|
| Use a 21-day pilot on your own operator tasks. | Measure each platform under the same 21-day condition. |
| Rank platforms by median days to 3 consecutive unsupervised cycles. | The score is the median days-to-3-consecutive-unsupervised-cycles; choose the platform with the shortest median. |
| Disqualify LMS completion tracking that reports only completion. | Any platform whose reporting stops at completion is ineligible because it does not establish unsupervised performance. |
| Compare task-embedded support and simulation authoring by dated performance events. | Track when operators complete 3 consecutive unsupervised cycles; completion records alone cannot decide the winner. |
This guide identifies the quickest path to demonstrated operator proficiency across LMS completion tracking, task-embedded performance support, and simulation authoring. It defines a 21-day pilot and a median-based selection rule grounded in consecutive unsupervised performance.

Completion rate is not a proficiency date
A completion record documents exposure, not proficiency. It can show that an operator opened a module, finished a video, or passed a quiz, but it does not establish when the operator performed the actual job correctly and independently. A proficiency record must attach a date to a work-performance event: the operator completed the task to specification, without assistance, at the required standard. The practical test is simple: ask for the task output, the performance date, and evidence that no manager or peer supplied the missing steps. If any of those elements are missing, the record measures participation rather than readiness.
Completion and proficiency correlate only when the assessment is the task itself. A quiz can resemble a procedure without testing its execution under normal operating conditions. A course can be marked complete after the operator has merely viewed the material, while the real performance remains delayed by uncertainty, missing equipment knowledge, or the need to ask someone for help. For each training item, therefore, check whether the completion rule and the proficiency rule are separate. Completion asks, “Did the operator engage with the training?” Proficiency asks, “Did the operator perform the specified work without help, and on what date?”
Acadia states that its mechanism is to inject the “One Best Way” protocol directly into each task, rather than requiring employees to rely on managers and peers for procedural guidance. That distinction explains why completion and proficiency can diverge. The operator may have completed every assigned learning activity yet still lack the in-task guidance needed to act. The mechanism relevant to time-to-proficiency is not the volume of training consumed, but whether the prescribed procedure reaches the operator inside the work itself and reduces the wait for an expert.
Use a paired check when reviewing a platform’s reporting. For every operator, place the latest completion event beside the latest independent task-performance event. If the dates are close, determine whether the learning activity contained the same procedure, sequence, and decision points required on the job. If it did not, apparent alignment is weak evidence: exposure occurred, but proficiency was not demonstrated. If the platform cannot produce a dated, unsupervised task record, its completion dashboard should not be presented as a proficiency date.
The governing rule is evidentiary: treat a proficiency date as earned only when a task was performed to specification without help. Treat every other event—including a module opening, a video ending, and a quiz pass—as an exposure marker. This keeps training evaluation anchored to observable job performance and prevents administrative completion from being mistaken for the point at which an operator became capable of working independently.

Evidence: one hard number, three silences
Higher completion rate does not mean faster readiness. Shapr3D’s published comparison reports 3–5 days to basic proficiency in Shapr3D, while Fusion 360 requires 400–1,200 hours for professional proficiency. At eight hours of work per day, the Shapr3D benchmark converts to 24–40 hours, making the basic-proficiency tier roughly 10–50 times less training time than the professional tier. That arithmetic is not a measured readiness result, and the tiers are not equivalent; that is precisely the point. A completion rate can describe the lower-cost tier while the output-changing proficiency remains untested.
| Source | What it actually supplies | Figure |
|---|---|---|
| Shapr3D | Published time-to-productivity benchmarks for different proficiency tiers | 3–5 days to basic proficiency in Shapr3D; 400–1,200 hours to professional proficiency in Fusion 360 |
The evidence exposes three silences. First, most completion reports do not supply a dated performance event: “completed” does not say when the operator first completed the real task correctly and without help. Second, they do not establish transfer from training to production; a quiz or module can be finished while the relevant work remains slow, inconsistent, or dependent on supervision. Third, they do not identify the proficiency tier represented. A benchmark for basic operation and one for professional production cannot support the same readiness claim.
Acadia explains the divergence through its “One Best Way” in-task injection mechanism: the prescribed procedure is injected into the task itself, so employees can access guidance while performing work rather than only after completing a separate learning module. A platform that records only course completion may miss the moment when that in-task support is no longer required.
Talentpool defines time to proficiency in operational terms: the time required for a new hire to reach an acceptable performance level, with longer time to proficiency associated with lower productivity. For an operator-training comparison, the check is therefore not “Who has the highest completion rate?” It is “Who produced the earliest defensible proficiency date?” Require a dated, task-level performance record demonstrating correct, independent work, identify the proficiency tier, and keep separate completion data as evidence of exposure rather than readiness.

Three architectures ranked by one test
Training platforms often report different things under the broad label of “completion.” A module finished in an LMS proves exposure; a cycle performed correctly in the workflow can date proficiency. The practical question is therefore not which platform has the most attractive completion dashboard, but which can identify the earliest point at which an operator performs the real task independently and consistently. That distinction makes the three architectures directly comparable—and makes task-embedded performance support the strongest candidate.
| Architecture | What it records | Proficiency evidence it can produce | Verdict |
|---|---|---|---|
| LMS completion tracking | Module completion, quiz scores, and logins | No native proficiency date; relevant dates must be reconstructed in spreadsheets | Disqualified as the sole system |
| Task-embedded performance support | Task cycles, protocol views, and supervisor sign-off | Per-operator cycle dates as a by-product of actual work | Winner |
| Simulation authoring | Practice hours and scenario scores | Time to scenario mastery, with a high ceiling for advanced preparation | Keep only for task-specific practice |
The key advantage of task-embedded performance support is that measurement happens where performance occurs. As explained above, Acadia’s “One Best Way” mechanism injects protocols into each task so guidance is available during the work itself — which is exactly why task-level activity, not a completion dashboard, can reveal when an operator stops relying on a manager or peer.
Apply the selection rule stated in the takeaways: rank eligible platforms by median days to 3 consecutive unsupervised cycles in the 21-day pilot, recording cycle dates, task identity, and sign-off status so the result reflects sustained independent performance rather than exposure, quiz performance, or practice hours.
Simulation authoring still has value, especially for rare, hazardous, or expensive scenarios that are difficult to rehearse in normal operations. Its limitation is that scenario mastery is not automatically workplace proficiency: the transfer from a simulated scenario to the live task must be checked. Likewise, LMS records can support compliance and reinforce course activity, but spreadsheets reconstructed afterward cannot provide the dated performance event the selection rule requires. The winning architecture is therefore task-embedded performance support, subject to the pilot result rather than feature claims alone.
Cost math for a day of proficiency delay
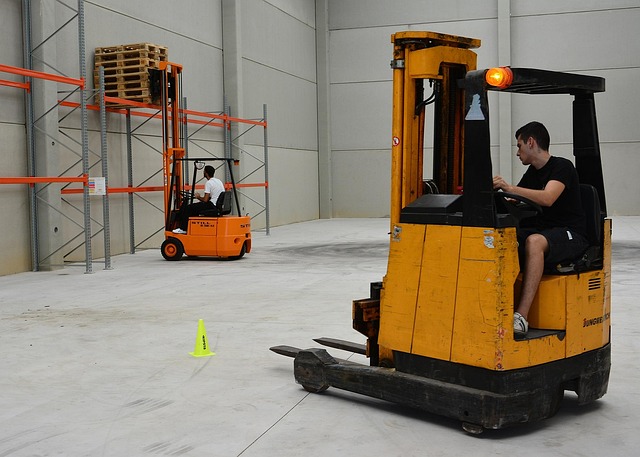
Calculate proficiency cost with a simple cohort model: cost to proficiency per cohort = operators × days to proficiency × shift hours × loaded hourly rate. The loaded rate should include wages, benefits, supervision, and other employment costs attributable to the operator’s time. For the worked case, a five-operator cohort working eight-hour shifts at a $34 loaded hourly rate costs $1,360 for every day of proficiency delay: 5 × 8 × 34 = 1,360. This is a method, not a vendor price; replace each input with your own payroll and operating data.
Use the model to put platform comparisons on a financial basis. Record the median days-to-proficiency for each platform on the same tasks, then multiply the difference in days by the cohort’s daily loaded cost. If the fastest and slowest platforms differ by six days, the daily cost becomes the spread value: 6 × $1,360 = $8,160 per cohort. The check is straightforward: a six-day advantage has the same economic value across platforms because it refers to the same operators, shifts, and loaded labor rate.
Annualize the result using the number of cohorts that will pass through training in a year. At four cohorts, a six-day platform spread produces 4 × $8,160 = $32,640 in proficiency-delay cost per year. The multiplier should be based on planned training volume, not an assumed customer count. If staffing varies, calculate each cohort separately: operators × days × shift hours × loaded hourly rate, then sum the cohort results.
Next to this delay figure, show the incremental annual licence cost of each platform, including the number of seats and any required add-ons. The decision rule is total economic cost: platform delay cost plus platform licence cost. A platform with a higher licence price can still be the better financial choice when its annual proficiency-delay cost is lower; a cheaper licence can lose when the delay exposure is large enough. The relevant break-even check is whether the annual reduction in delay cost exceeds the annual licence difference.
Report the result as a range around the median days rather than as a guaranteed saving. The deeper operational check is whether the platform’s result holds across the tasks operators will actually perform and whether supervision can confirm three consecutive unsupervised cycles. This cost model does not make a training platform profitable by itself; it prevents a licence comparison from hiding labor exposure. Before approval, replace all example inputs with your own rate, measured task days, annual cohort volume, and quoted licence total, then apply the same formula consistently to every option.
Worked pilot: 5 operators, 21 days
Use the following as a pilot method, not as a finding. Run one cohort of five operators on each candidate platform. Include three representative tasks: start-up and shutdown, an in-specification changeover, and first-line fault reset. Give each cohort 21 calendar days to complete the tasks, and use the shift supervisor as the assessor. A task attempt passes only when the operator performs the full task to specification without prompting. An operator has reached the proficiency bar for a task after completing three consecutive unsupervised cycles at specification.
Check progress at fixed intervals. On day 7, count how many operators in each cohort have completed at least one clean unsupervised cycle on each task. Treat that count as an early readiness check, not as a result. If an operator has not reached a clean cycle, record the failure point, the support provided, and the next planned intervention. Keep the same intervention log for every platform so that coaching differences do not contaminate the comparison.
On day 14, count operators who have completed at least two consecutive clean unsupervised cycles on each task. For every attempt, record the number of supervisor prompts and whether the result met specification. Distinguish among no prompt, one prompt, repeated prompts, and an out-of-specification result. Prompt counts are diagnostic evidence: a cycle that required intervention is not an unsupervised cycle, even when the operator ultimately reaches the correct outcome.
Frequently Asked Questions
How long should the pilot run for each platform?
Use a 21-day pilot on your own operator tasks, measuring every platform under the same 21-day condition.
What result determines which platform ranks first?
Choose the platform with the shortest median days to 3 consecutive unsupervised cycles.
When should a platform be disqualified from the comparison?
Disqualify any platform whose reporting stops at completion because it does not establish unsupervised performance.
Can LMS completion tracking alone identify the fastest path to proficiency?
No, because completion records document exposure rather than when an operator performed the actual job correctly and independently.
What event should be dated in a proficiency record?
Date the work-performance event in which the operator completed the task to specification without assistance.
How should task-embedded support and simulation authoring be compared?
Compare them using dated performance events rather than completion records.
Quick answers
| How should platforms be tested to identify the quickest path to demonstrated operator proficiency? | Use a 21-day pilot on your own operator tasks and measure each platform under the same 21-day condition. |
| What metric should be used to rank platforms? | Rank platforms by median days to 3 consecutive unsupervised cycles and choose the platform with the shortest median. |
| Why is LMS completion tracking alone ineligible for determining proficiency? | Any platform whose reporting stops at completion is ineligible because it does not establish unsupervised performance. |
| What should operators' performance records attach to a work-performance event? | A proficiency record must attach a date to a work-performance event. |
| What evidence should be compared when evaluating platforms? | Compare task-embedded support and simulation authoring by dated performance events. |
Also worth reading: How competency-mapped manager academies reduce promotion failure rates by 30%: A 2024 LPI benchmark analysis: How competency-mapped manager academies reduce · Build or buy an academy LMS: 2026 cost and launch time compared: Build or buy an academy · Employee Onboarding LMS 2026: 5 Criteria vs 30-Day Pilot: Employee Onboarding LMS 2026: 5